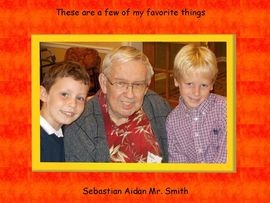
Today students will begin a new project that they will present as a gift to their "adopted grandparents" at Dogwood Village. On one of their first visits of the school year, students asked their "adopted grandparents" a series of questions about their favorite things. They will take that information and use Pixie to create a present over the next few weeks. Below is an example of the cover of one project from a previous year.
Now that everyone in the class has completed their Lego bar graphs in Excel, the students will use computer class today to explore other graphing options in Excel using their Lego data.
Each half of the class is meeting for a full period for this computer activity about graphing. The beginning of the class was a brief review about the benefits of graphing. During math in their classroom, students previously sorted a small bag of Legos by color and graphed them on a worksheet. They took the same data and entered it into an Excel Spreadsheet to create a bar graph and then looked at other ways to present the data (e.g. column, line, pie, bar, doughnut, etc.)
Today I will introduce the class to the concept of spreadsheets. They will learn that spreadsheets are used for information that is laid out in tables and that people use spreadsheets to sort, calculate, and graph. The students will learn 4 new vocabulary words – worksheet, column, row, and cell. We will also do an exercise in which they will start Microsoft Excel, learn to navigate a spreadsheet, identify cells, and enter data which will create a recognizable picture.
|
GalleryLinks to the students work Archives
May 2015
Categories |