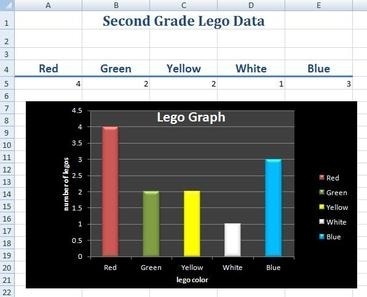
Today we will begin a project about graphing using spreadsheets after a brief review about the benefits of graphing. During math in their classroom, students previously sorted a small bag of Legos by color and graphed them onto a bar graph worksheet. They will use the same data as a basis for an Excel Spreadsheet to create a bar graph; we will also look at other ways to present the data using Excel spreadsheets and compare them (e.g. column, line, pie, bar, doughnut, etc.)
Today I will introduce the class to the concept of spreadsheets. They will learn that spreadsheets are used for information that is laid out in tables and that people use spreadsheets to sort, calculate, and graph. The students will learn 4 new vocabulary words – worksheet, column, row, and cell. We will also do an exercise in which they will start Microsoft Excel, learn to navigate a spreadsheet, identify cells, and enter data which will create a recognizable picture.
This week students will work to create a unique look for the text of their snow poem, which has been added to an image of a snowflake they created earlier using an online tool. They will use features in Pixie to change the font style, color, and size of the text. The completed project will be printed out and displayed in their classroom.
|
Archives
May 2017
Categories |