Here are some great web based chart tools that you can use beyond the standard Microsoft Excel. Many of them came from an excellent T&L Advisor Blog article called - Top 10 Sites for Creating a Chart or Graph and 22 Useful Online Chart & Graph Generators.
|
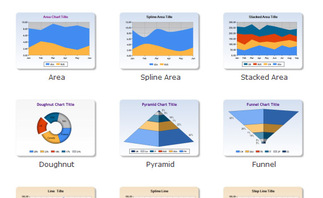
DIY Chart - DIY (Do it yourself) Chart is a Web-based, simple and powerful online tool to create interactive charts and graphs from static or dynamic data which may be generated using any scripting language.
|
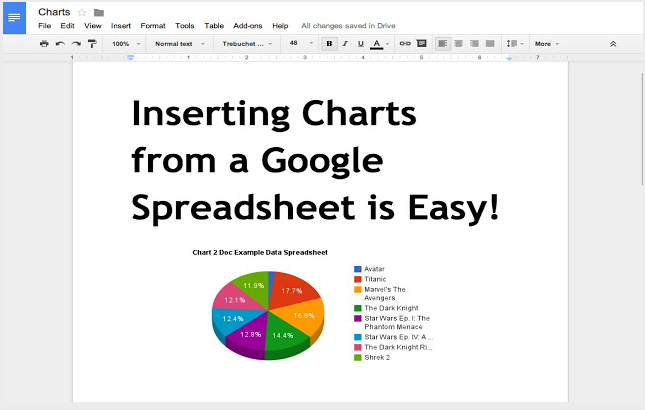
Google Apps Spreadsheet -
Google spreadsheets makes it easy to track budgets, run financial calculations, track data and more.
|
Charts Builder - Now you can build a chart from data in your Google Spreadsheet and insert that right into your document.
|
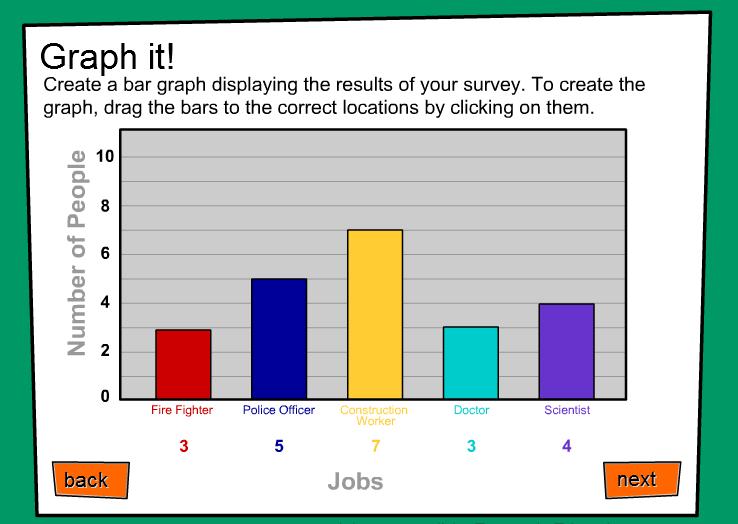
Here's a great online activity from EconedLink that teaches younger kids about graphing:
|
|
Rich Chart Live - An excellent site for created animated flash based charts that can be embedded into a site. Also, a user has the ability to add links to a chart.

|
iCharts - A wonderful site/network for creating charts that you can embed into a site. Also, a user can share charts on social networking sites and browse/save other iCharts from the web.

|
Chartle - A great site for creating online interactive charts. What makes Chartle so unique and impressive is the ability to create more than your standard graphs such as: venn diagrams, maps, gauges, and more.
|
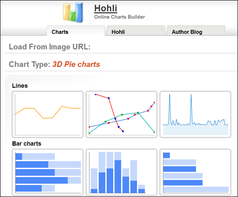
Hohli - A very user-friendly site, similar to Chartle. Users can create a variety of charts, such as pie, scatter plots, and radar, then embed them into a site.
|
|
Lucid Chart - A nice site for creating a variety of different charts and diagrams. Also, it is a very easy site to use with a drag-n-drop interface. Best of all, Lucid Chart has an educational portal which allows chart creation free for education.

|
ChartGo - ChartGo is a neat site for creating charts that's very easy to use. All a user has to do is fill out the pre-determined sets of data and select the type of chart they want to create.

|
Pretty Graph - A simple site to use to make a wide variety of graphs, such as: line charts, histograms , and more. Also, a user can embed into a site, share with others users via email, or save as template.

|
Diagramly - A cool site for creating diagrams, flow charts, and more that is similar to Lucid Chart. Users of Inspiration should feel right at home w/ this online tool as there are plenty of shapes and clip art to choose from.
|
|
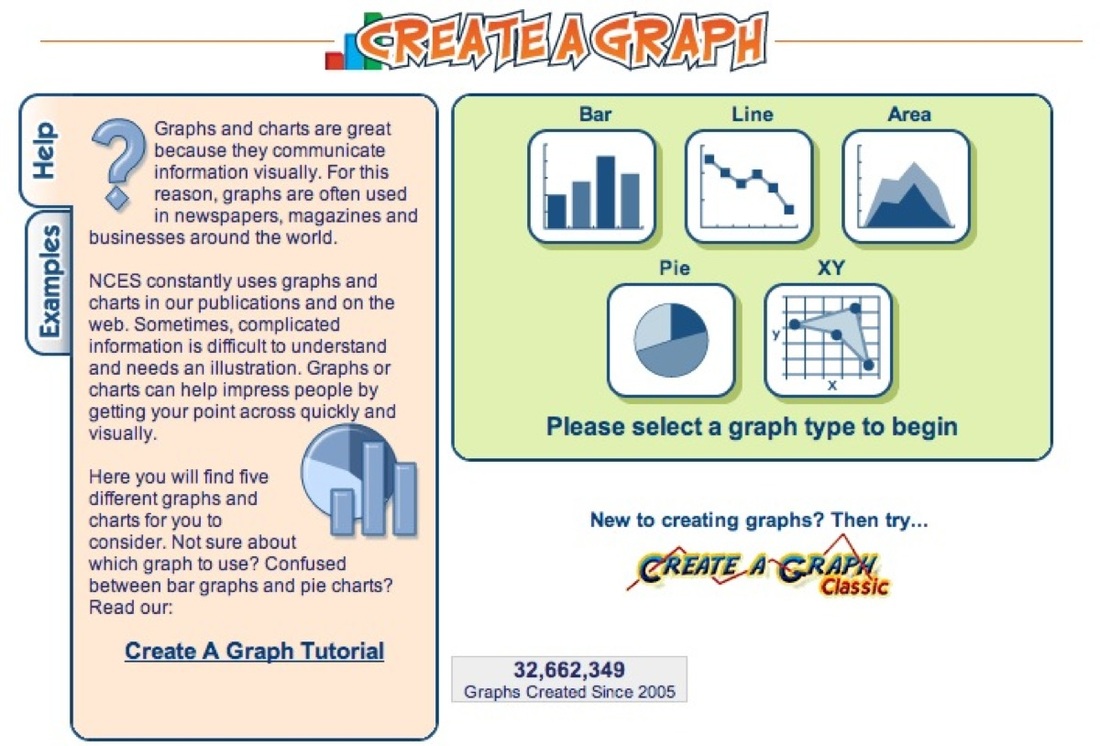
This tool is provided by NCES. The National Center for Education Statistics (NCES) is the primary federal entity for collecting and analyzing data related to education.
|
Cacoo - A great site for creating online charts and diagrams. A great feature is the ability to collaborate with others in real-time while creating a chart via a chat.

|
Lovely Charts ($) - A easy site to use to make very polished charts. While not free, there are three paid versions to choose from, such as: iPad, online, or desktop.

|
Useful Charts - While not a chart creation tool, this site has some of the best-looking charts for every subject. Also, laminated charts can be ordered for the classroom.

|
Infographics
The Educators' Guide to Infographics article compares the features of Cava, PictoChart, VennGage, and infogr.am.
|
Canva - gives you everything you need to easily turn ideas into stunning designs.

|
PictoChart - Easy-To-Use Infographic Creator Discover how non-designers are creating beautiful infographics in as little as 10 minutes.
|
VennGage - Create beautiful infographics, reports, or data visualizations. Thousands of ways to customize, infinite possibilities.

|
infogr.am - Infographics & charts. The easy way. Choose a template, visualize your data, publish and share.

|
|
How to Create PowerPoint Infographic Elements - This article provides instructions and videos on how to create infographics with PowerPoint 2013. You will need to add the Merge Shapes feature if you are using an older version of PowerPoint. Along the way you will learn a lot of general tips on using PowerPoint.

|
