Today we will be creating Pioneer Trading Cards using an application on Big Huge Labs.

|
Today we will be creating Pioneer Trading Cards using an application on Big Huge Labs.
0 Comments
I setup Arcademic login accounts for all the students for the summer. I will show them how to setup a "private" game, so they can compete if they want to. 
This week we started our Great American's biography project. The students took facts that they researched in social class and created a presentation using Microsoft Powerpoint. They are inserting photos, editing text, and adding clip art.
We took a virtual field trip to Washington DC using Google Earth. We saw the National Mall, Lincoln Memorial, Washington Monument, Capitol, and Jefferson Memorial. Along the way we saw the World War II Memorial and the Tidal Basin. At each of the locations we watched videos about the life of the person the site is dedicated to, the history of the building, and took a tour of the building. We learned a little about Google Earth and had fun visiting some 360 degree photos.
The second grade class made their adopted grandparents at the Orange Nursing Home a present for their last visit. One of the activities they do int he school year is to interview their adopted grandparent to learn about them. We used that information to put together a book for them called "These are a few of my favorite things.
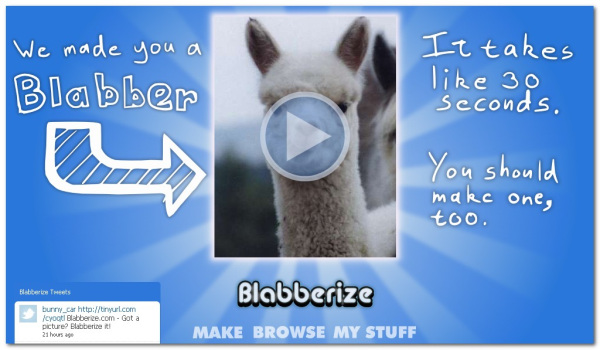
This weeks class will introduce the students to the concept of moving text around. They will unscramble the Pledge of Allegiance by selecting individual words and moving them to the right place. Then they will unscramble the National Anthem by selecting entire lines and moving them to the right place. Here are the two documents they will be using: As part of their study on China, the 2nd grade did research on pandas and wrote essays about what they learned. Last week they recorded their essays using Audacity. This week they'll be making a "Blabber". Here's an example of one:
We'll be learning how to use spreadsheets to calculate. Students will be coming to class with their math work. We'll be taking that same information and putting it in a spreadsheet to double check their work.
We talked about different graph types and when to use them. We talked about a bar/column graph, pie chart, and line graph. The students explored with their Lego Graphs and looked at different ways to represent them in Microsoft Excel.
In math class, the students sorted Legos by color and graphed them on a sheet of paper. They took the same data and entered it into an Excel Spreadsheet to create a bar graph. You can see their graphs at the following website: http://grymeslab.weebly.com/lego-graphs.html
|
AuthorWrite something about yourself. No need to be fancy, just an overview. Archives
May 2012
Categories |
 RSS Feed
