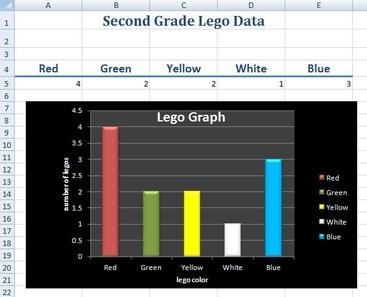
Each half of the class is meeting for a full period for this computer activity about graphing. The beginning of the class was a brief review about the benefits of graphing. During math in their classroom, students previously sorted a small bag of Legos by color and graphed them on a worksheet. They took the same data and entered it into an Excel Spreadsheet to create a bar graph and then looked at other ways to present the data (e.g. column, line, pie, bar, doughnut, etc.)
 RSS Feed
